Over the last few months, we’ve been readying Clever SSO for our biggest year ever. We want students across the country logging in quickly and reliably to all of their learning applications. A couple of months ago, we described our initial stress testing approach. In this post, we want to tell you more about this stress testing, how we’ve worked to isolate faults across Clever’s systems, and how we’re now working to make every Clever code deploy even safer than before. We also want to review our uptime metrics and dig into the small service disruption we experienced in late May. Finally, we want to tell you more about how we’re going to be communicating with you, our users, when there is a service disruption.
Metrics
A few weeks ago, we laid out a definition of our uptime. We count a minute as “down” if 10% or more of Clever login attempts fail for any reason, outside of our occasional, pre-announced maintenance windows. Based on this definition, our uptime numbers are 100% in May and 99.997% in June. The downtime in June was just over a minute, and was due to a faulty deploy that we quickly noticed and reverted.
Service Disruption in May
Though our metric definition applied to May gives us 100% uptime, we did have a minor service disruption on May 30th. It never met the threshold of a “down minute,” which led us to wonder if we should reevaluate our metric. The issue, which we explain in detail below, caused sporadic errors for 75 minutes spread across 5 hours. The worst minute saw 8% failures, while most of the faulty minutes were below 3% failures.
We spoke with a number of districts and applications customers to understand how they had experienced these failures. Customers told us that they had not experienced this as downtime: some saw a very occasional error screen, others noticed a bit of slowness, while most noticed nothing at all. We concluded that, for now, our metric is correct in that it matches our customers’ experience. We’ll continue to reevaluate this and look at possibly measuring minor service disruptions separately from downtime. And of course, we’ll still dedicate all the requisite engineering power urgently when these minor disruptions happen.
What was this service disruption, then? It was an interesting one! On May 30th mid-morning, we received alerts of sporadic errors affecting a small percentage of our Clever Portal requests. We activated our incident response process and determined within a few minutes that a handful of instances of one of our internal services were crashing, causing in-flight requests to error out. These errors did not affect users, since we have configured our services to retry, and the error rate was low enough that retries masked the problem for end-users. However, once enough instances of the service crashed, the surviving instances would occasionally become overwhelmed and time out, which did eventually trickle up into some user-observable errors. In terms of user impact, we noticed one district was particularly affected, while others encountered an occasional error, manually retried, and got through. In other words, for most users this was imperceptible, for a small fraction of our users this was noticeable but tolerable, and for some users within one school district, the Portal became difficult to use.
Error rates over 5 hours on May 30th show up to 8% errors in a given minute.
Through log analysis, we were able to determine within the hour that this issue was caused by the introduction of a new feature the day before – custom sections – and in particular the use of very large custom sections. In fact, through the use of this new feature, the largest section on May 30th was two orders of magnitude larger than the largest section on May 29th. This was not a scale we had properly tested, and it was such a large difference that it caused an out-of-memory error in an internal service — the one that then started crashing. The single district that was particularly affected was, in fact, the district where these very large sections had been created.
We want to be clear: this was not user error (In fact we hate the term “user error.”) We offered a feature, and it was immediately put to good use – that’s what we like to see when we release new features. We simply didn’t anticipate the full scale of how that feature might be used — and that’s on us.
After quick discussion with the affected district, we mitigated the issue by removing the very large sections and adding a limit to the section size. This is an important concept we’re focusing on: when in doubt, default to rollback to ensure that students can keep logging into Clever and learning applications. Then, follow up with the work required to re-enable the feature we’ve rolled back.
When we look at this outage, we conclude:
- Sometimes, new features are going to be used in ways we don’t anticipate. As we get better about stress testing, we’ll reduce the likelihood of this happening, though we need to be ready to roll back new features very quickly if some unexpected edge case is encountered in production. Rolling back a feature temporarily is never fun, but it’s better than causing service disruptions. To help prevent this type of issue in the future, we’re updating our new-feature technical specification template to include explicit resource-limit expectations.
- Even with this unexpected use of our new feature, Clever services remained functional for the overwhelming majority of our users. We’re proud of that.
- Our response to this issue was focused and effective for the most part. One area we’re going to improve is an even stronger focus on rollback before asking too many other questions: we believe that, had we been more aggressive in rolling back the feature, we may have been able to limit the impact to fewer than 60 faulty minutes over 4 hours.
Even Safer Code Deploys
At Clever, we deploy code multiple times per day. Most of the time, we do it safely, thanks to testing, canary-ing of new code, and rapid rollbacks if all else fails. That said, we’ve observed that, when we do have rare service disruptions, they’re most often caused by faulty code deploys. Our safety rating for code deploys is pretty good, but we release enough code that the number of faulty deploys that affect customers is not sufficiently low. As a result, we’ve decided to invest in making code deploys even safer.
First, we’ve improved our automated tests to catch errors when logging into both the Clever Portal and learning applications, where previously we were automatically catching only Portal failures. This means that any deploy that is buggy in a way we don’t catch before full deployment will ultimately get caught by our automated tests, which will fire off a page within 2 minutes.
Additionally, we want to make it even less likely that such faulty deploys will happen in the first place. We’re moving to make our code canary process safer by default. Canary-ing services is the practice of deploying new code first to a small subset of server instances, and then to the remaining instances only once the canaries indicate that they’re working. To date, that full-deploy decision has been made manually: we canary a new code release, test manually, watch error logs, and interrupt the deploy process if any doubt arises. We’re now undertaking work to introduce a stricter, more automated release decision process: the error rate on canary services will be automatically monitored and, if it deviates from the error rate on the older version of the code, the deploy will be automatically rolled back. With this safety net in place, we are confident that our brief June service disruption would have been prevented before deploy.
Architectural Improvements
Since our last update, one of our major architectural improvements has been the fault-isolation of key internal services. We now ensure that services in the critical path for users logging into the Clever Portal and learning applications are used only for the purpose of users logging in. In other words, if many of our districts sync large amounts of data with Clever, the computational and network load created by these syncs will not affect the services needed for students and teachers logging in. If we’re under particularly high sync load, syncs and sharing may be delayed, but logins won’t be affected.
Thanks to this isolation, we are now able to strictly monitor the response time of these critical-path services and catch performance regressions before they bite our users. Our daily automated testing shows that all of these internal services now have a 99th-percentile response time below 20ms, and often below 10ms. This is a dramatic improvement over their response time from a few months ago, where a number of services had a 99th-percentile response time above 100ms, sometimes closer to 500ms. Not only are these order-of-magnitude improvements making Clever more reliable, they’re also making the Clever end-user experience faster.
We’ve also carried out database version upgrades across our systems. In particular, we’re now no longer vulnerable to the lock-contention bug that became an issue during our outage last March. Combined with more efficient queries across the board and the partitioning out of some datasets into separate database clusters, we’ve seen dramatically improved performance of our databases. All of this is reflected in our stress testing results.
Stress Testing
Every 1-2 weeks over the last few months, we’ve carried out stress testing on our infrastructure via synthetic traffic generation. Using a collection of background workers, we simulate logins at increasingly high rates, right up until our systems fail. Paradoxically, the goal is to fail. We then post-mortem the failures, understand the bottlenecks, address them… and start again. We’re pleased with the results:
- In mid June, we carried out a stress test that brought Clever systems to 1.6x the peak traffic we experienced in 2018, at which point we saw one database deteriorate and fail. We worked to optimize usage of that database.
- In late June, we then carried out a stress test that, unfortunately, also went no further than the 1.6x mark, this time failing because of a different database’s limitations. We put in the work to optimize usage of that second database.
- In early July, our efforts broke through in a major way: our stress test reached the 3.2x mark. Still, we saw room for improvement.
- Over the last couple of weeks, we were able to run stress tests up to 4x, and then 5x 2018 peak traffic. We now believe this capacity will take us well into the next year.
With this stress testing now in a good place, we’ve moved to ensure that our performance doesn’t regress as we release a number of new features for all of our users this Fall. Every evening, once organic traffic has died down, we now run an automated load test that is large enough to hit our expected traffic this Fall, but not so large as to come too close to our known stress-test breaking point. If the load test reveals an issue, we’re ready to address it immediately, before the next school day begins.
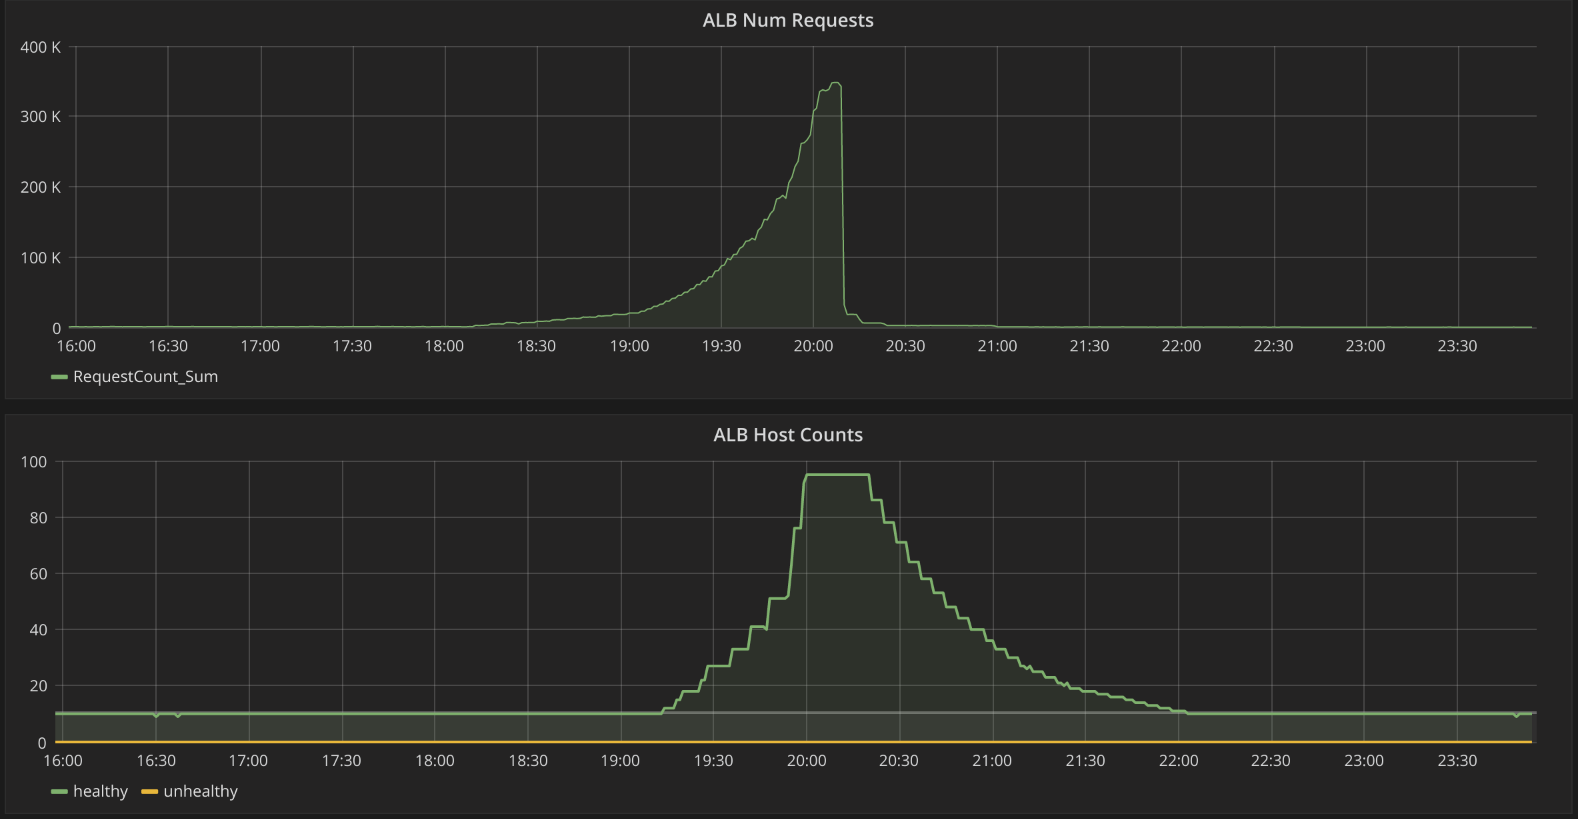
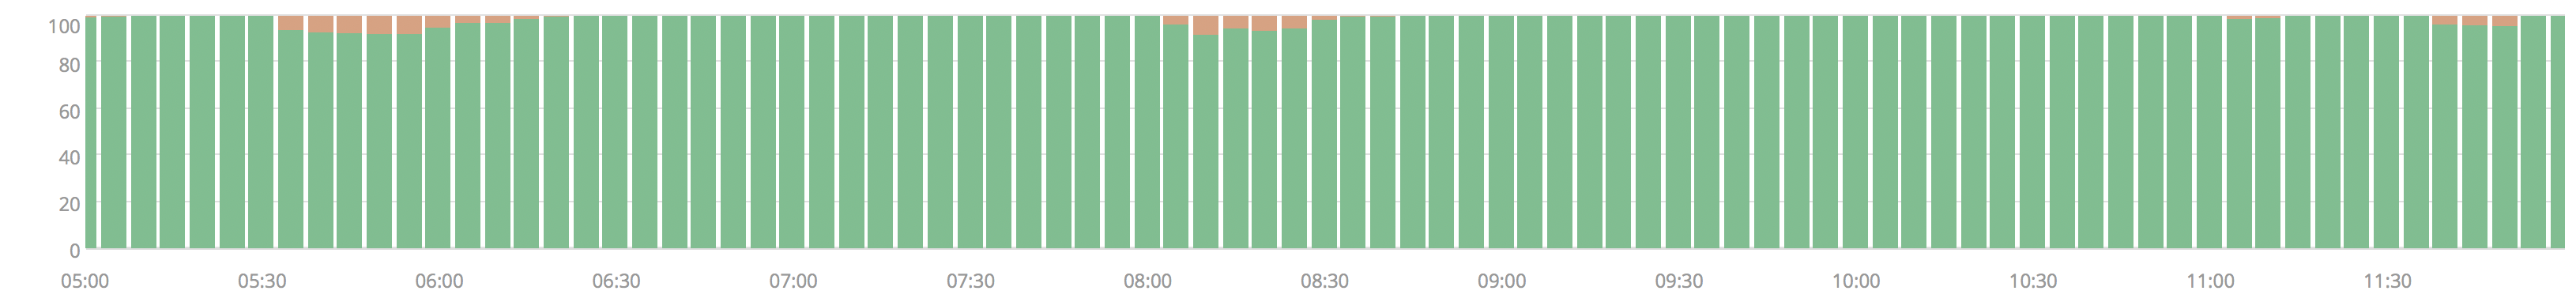
Automated synthetic load tests in the evening in action: one of our key services auto-scaling up to handle the traffic.
There’s more stress testing for us to do: we plan on varying the mix of district configurations in our synthetic traffic generation to make sure we are mimicking increasingly realistic production traffic over time. We also plan on testing some mitigation strategies we’ve prepared in case we still hit load-related issues.
Failure Communication
Even as the bulk of our focus is to improve the resilience of our systems under load and during failures, we know that, in the unlikely event of an outage, it is important to communicate effectively. We have updated our documentation with details for both district administrators and application teams to subscribe to outage updates for Clever services you rely on. Our team has defined a clear internal communication process during failures to ensure that we will provide timely and actionable updates during outages.
Additionally, we have been working to ensure that teachers and students in the classroom are presented with clear error messages in our products in the case of an outage. In cases where more than 10 percent of logins are failing, our student- and teacher-facing pages will display an alert informing them of the issues and expected resolution times. In cases where the service is completely unable to respond, we will show error pages that describe the outage with a pointer to our status page.
Our goal with this improved in-product communication is to ensure that teachers in the classroom are aware that Clever is experiencing issues, and that they never blame one of the learning applications they’re trying to access. Additionally, we want to provide the information teachers need to plan their classroom time around any issues we encounter, with updates at least every hour.
Have a Great Back To School!
We have been working hard to ensure that teachers and students can rely on Clever every day, and we’re excited to see the activity on Clever picking up already as the school year begins in some States. We want to wish all the amazing teachers around the country a great Back To School. We’re going to be working closely with all of our districts to make sure Clever helps make 2018 a particularly successful Back To School for all Clever users.
We’re also thinking about how we get ready for next year. We want to continue to improve Clever’s resiliency, even in the face of the most extreme hardware and network failures, including an outage of an entire Amazon Web Services region. To do this, we’re going to be investing in building fully redundant stacks in geo-distributed locations. This has implications across our infrastructure, and we’re only just getting started. We’ll keep you posted on this blog.